How to build an investment-grade company scoring system with Make and alternative data
Discover how to use Make to transform raw alternative data into a structured, explainable company scoring system for investing, corp dev, or GTM prioritization.


Most company scoring systems rely on static firmographic data or non-transparent machine-learning models. The result is either outdated insights or scores that are impossible to explain.
But what if you could build a time-aware, explainable company scoring system using real-world signals without writing any code?
In this guide, we’ll walk through how to use Make and alternative data to build an investment-grade company scoring workflow using Google Sheets as the output layer.
Why alternative data matters for company scoring
Traditional datasets answer questions like:
- How big is the company?
- Where is it located?
- What industry is it in?
Alternative data answers more important questions:
- Is the company hiring right now?
- Are they investing in leadership and new tools?
- Is something changing internally?
By using signals such as job openings, news events, and technology adoption, you can measure momentum instead of static attributes.
Real-world use cases: Who it is for
This type of scoring system can be used for:
- Investment screening
- Corp dev target prioritization
- Sales and GTM account scoring
- Partner evaluation
- Market monitoring
What makes a scoring system “investment-grade”
Before building the workflow, let’s define the requirements.
An investment-grade scoring system should be:
- Time-based - focused on recent activity rather than snapshots
- Explainable - every score can be traced back to signals
- Composable - signals can be added or removed easily
- Automated - no manual updates or scripts
Overview: the Make workflow architecture
At a high level, the scenario looks like this:

Each company is processed independently, and all signals are written back once per run.
Step 1: Set up your company list in Google Sheets
Create a Google Sheet with one row per company:
Example columns:
- domain
- jobs_90d
- jobs_30d
- senior_roles_90d
- score

This sheet will act as both your input and output layer.
Step 2: Create a new Make scenario
- Log in to your Make account
- Click Create a new scenario
- Add Google Sheets → Get rows as the first module
- Select your company list sheet
Build automations via natural conversation with Maia!
Step 3: Iterate through companies
Add:
- Tools → Iterator
Map the rows from Google Sheets.
From this point on, every step runs once per company domain.
Step 4: Count job openings in the last 90 days
Now let’s add the first and strongest signal: hiring activity.
PredictLeads → List Job Openings
Configure:
- Domain = current row domain
- first_seen_at_from = now - 90 days
This returns one bundle per job opening.
Tools → Array Aggregator
Collapse all job bundles into a single array.
Tools → Set variable
Create:
jobs_90d = length(aggregated_jobs)
This gives you the total number of new roles opened in the last 90 days.
Step 5: Identify senior hiring activity
Leadership hiring often signals strategic growth.
PredictLeads → List Job Openings (90 days)
Reuse the same 90-day query.
Filter
Keep only roles where:
- seniority ∈ manager, director, head, VP, executive
Array Aggregator + Set variable
Create:
senior_roles_90d = length(aggregated_senior_jobs)
Step 6: (Optional) Add short-term momentum
Repeat the same pattern with a 30-day window:
jobs_30d = job openings first seen in the last 30 days
This allows you to measure hiring acceleration.
Step 7: Update Google Sheets (single write)
At the very end of the scenario:
Add Google Sheets → Update row Match rows by:
- domain
Update:
- jobs_90d
- Jobs_30d
- senior_roles_90d
- last_scored_at
This ensures all metrics land in the same row.
Why does it give you
This approach ensures:
- No race conditions
- No partial updates
- Fully explainable numbers
- Easy debugging
- Easy extension
Each dataset is processed independently, and Make acts as the orchestration layer.
Extending the workflow with more signals
Once the jobs block is stable, you can easily add:
News events
- Count high-confidence events
- Detect negative signals like layoffs
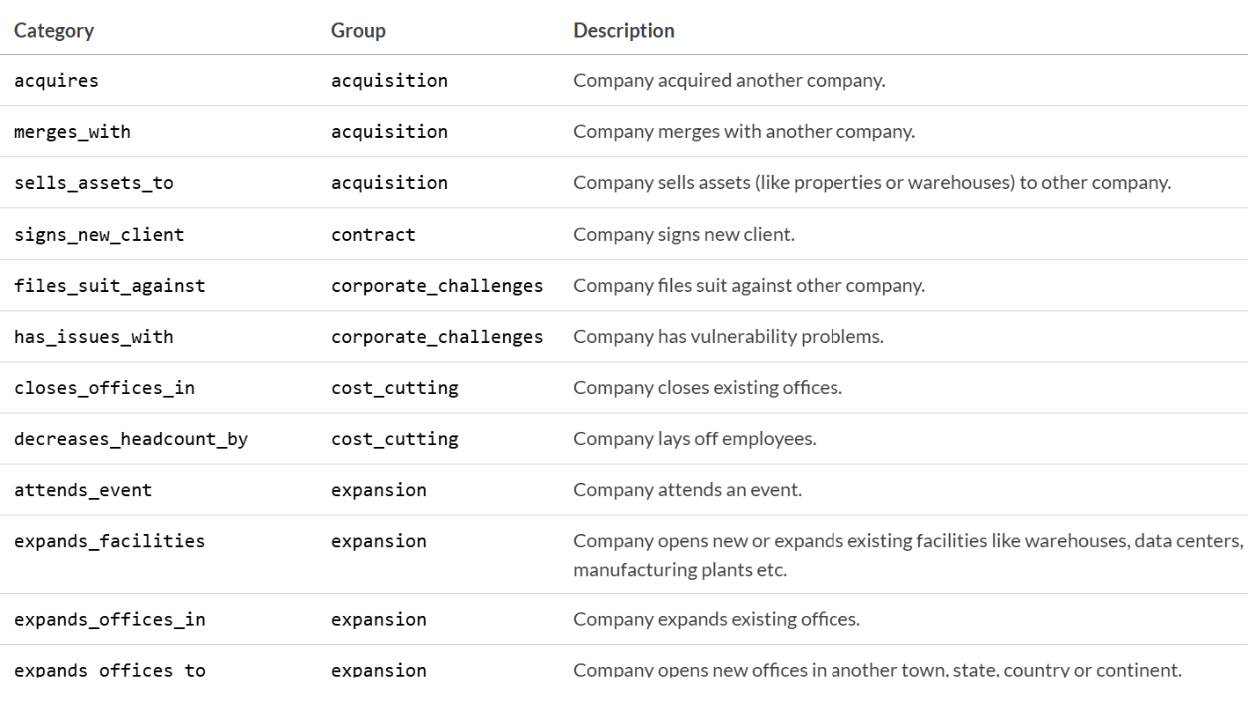
All categories can be found here.
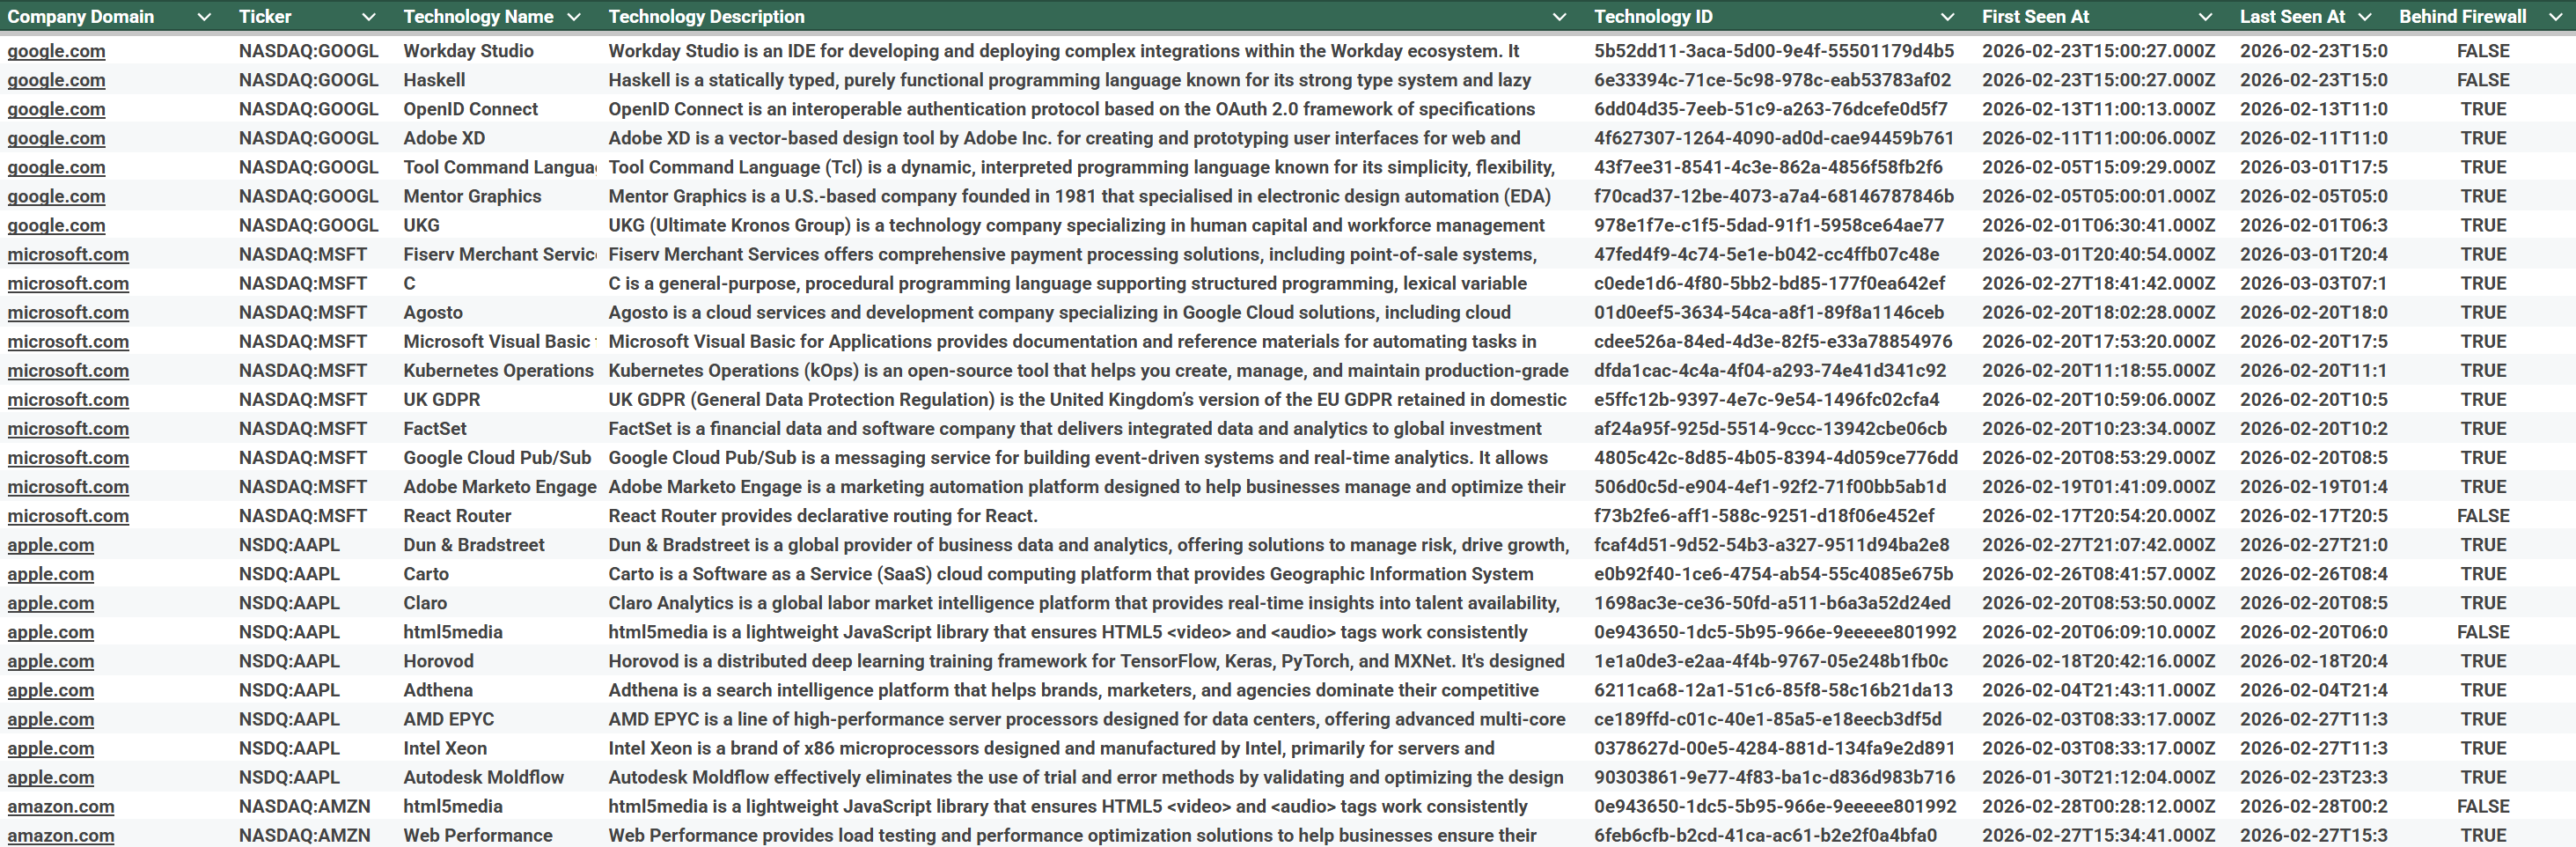
Technology adoption
- Measure modern tech stack usage
- Detect recent tooling changes
Each signal follows the same pattern:
Fetch → Filter → Aggregate → Variable
Related guides
Tool and strategies modern teams need to help their companies grow.

How-to guides
How to automate 360-degree feedback and performance analysis with Make and AI
Learn how to automatically analyze 360-degree feedback with AI, extract strengths and development areas from open-ended responses, generate polished performance reports, and deliver insights to managers—without manual data processing.

Margo Nikitina
February 25, 2026
.png)




.svg)
.svg)
.svg)